On September 16th the Federal Reserve raised the federal funds rate by 25 bps to a range of 3.75% to 4.00%. The vote was 12 to 0 and it was the first hike since July 2023. Chair Kevin Warsh told reporters that inflation has been too high for too long and the updated dot plot showed 16 of the 18 participants penciling in at least one more hike this year with four of them seeing two. This wasn’t a one and done move. The Fed is telling us a hiking cycle has started.
I think this was the wrong decision and I laid out most of the case before the meeting (can be read here) where I explained why you can’t hike your way out of an oil shortage. Now that the hike is official I want to go deeper on what it means for the economy rather than re-argue the diagnosis. The short version is that the Fed just raised the cost of capital for every household and business in America to fight a problem that was created in the physical oil market. The people who are going to feel it first are the ones who can least afford it.
Start with the numbers that got us here. Core CPI rose 0.3% in August and 2.4% YoY which was the lowest core reading since March 2021. Headline CPI was 3.4% and the gap between the two is energy. When the Fed cut by 50 bps in September 2024 core CPI was 3.2%. The monthly core print before that cut was 0.3%. The monthly core print before this hike was 0.3%. The same monthly number produced a 50 bps cut in one cycle and a hike in the next. I understand the funds rate was 5.25% to 5.50% then and 3.50% to 3.75% now so the starting points were different. That still doesn’t explain how 3.2% core justified easing while 2.4% core justifies tightening. The 2% target isn’t setting policy. Discretion is. I’ll address the Fed’s preferred PCE measure later in the article because it’s the strongest counter to that comparison.
You can’t hike your way into more barrels
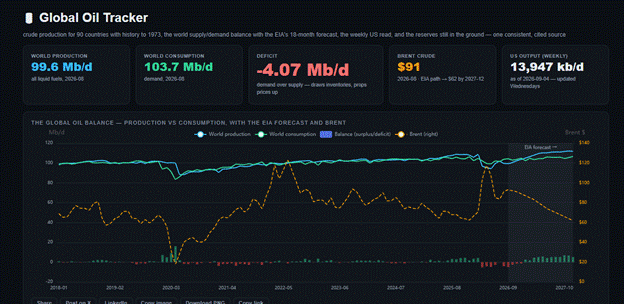
World oil production vs consumption with the EIA forecast and Brent (Nowflation Global Oil Tracker)
The global oil tracker on Nowflation tells the story in one chart. Using EIA data, world production was 99.6 million barrels per day in August against consumption of 103.7 million which is a deficit of 4.07 million barrels per day. That gap is being filled by inventories and inventories don’t last forever. Brent averaged $91 in August and traded around $105 in the week before the meeting. Look at where the barrels went missing. Saudi Arabian production is down 28.3% YoY. The United Arab Emirates is down 29.1% and Iran is down 24.9%. The International Energy Agency (IEA) said in its September Oil Market Report that more than 10 million barrels per day of Gulf output was still shut in during August and observed inventories have drawn 507 million barrels since February.
That’s what flowed into the CPI. The August CPI report showed the energy index up 16.3% YoY with gasoline up 27.4% and fuel oil up 52%. Gasoline alone produced more than one-third of the monthly increase in headline CPI. Core CPI decelerated from 2.5% to 2.4%. Services excluding energy services ran at 3%. Average hourly earnings grew 3.1% YoY in August which is a wage trajectory that’s consistent with 2% inflation once you account for productivity. Nothing in that data looks like an economy that’s running too hot. It looks like an economy that got poorer because energy got scarce.
Higher rates don’t change any of that. Raising the funds rate doesn’t produce another barrel of oil. It doesn’t repair a shipping lane, bring Gulf production back online or add refining capacity. What it does is raise the cost of variable-rate borrowing and the rate at which households, businesses and the Treasury have to issue or refinance debt. If inflation were being generated by excess demand then tighter policy would attack the source. When inflation is being generated by a supply shock then higher rates attack demand without fixing supply and the economy pays twice. It pays at the pump and then it pays again on every loan. Warsh acknowledged at the press conference that the Fed has no real capability of cutting off the main source of inflation which is higher energy prices. He hiked anyway.
The 10-year isn’t normalized at 5%
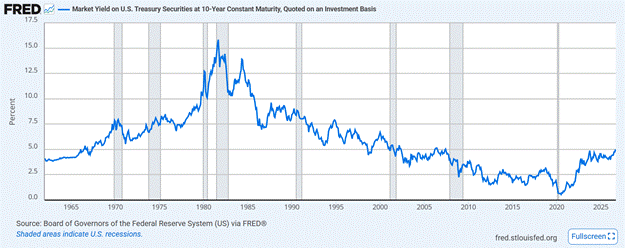
10-year Treasury yield since 1962 (FRED DGS10)
The 10-year Treasury closed at 4.97% on September 14th according to the rates page on Nowflation which is 92 bps higher than a year ago. The 2-year sits at 4.65% and the 30-year is at 5.34%. The hawks like to point to the chart above and say a 5% 10-year is historically normal. They’re right if your reference point is 1995 or 2006. The problem is the American economy of 2026 wasn’t built at 1995 rates. Look at the right side of that chart. From 2011 through the end of 2021 the 10-year spent most of its time between 1.5% and 3% and it bottomed near 0.5% in 2020. That’s more than a decade of households, corporations and the federal government making borrowing decisions based on cheap money. The debt those decisions created doesn’t go away when the Fed changes its mind. It just has to be refinanced.
Normal isn’t a number on a 60-year chart. Normal is the rate the existing debt stock was underwritten at and that number is a lot lower than 5%. Household debt reached $18.771 trillion at the end of Q2 with $13.117 trillion in mortgages, $1.713 trillion in auto loans and $1.263 trillion on credit cards. The marketable Treasury book is $31.82 trillion with a weighted coupon of 3.26%. Every one of those dollars was borrowed in a world where the 10-year looked like the right side of that chart and every one of them is going to roll into a world where it looks like the left side.
The 30-year mortgage isn’t normalized between 5% and 7% either
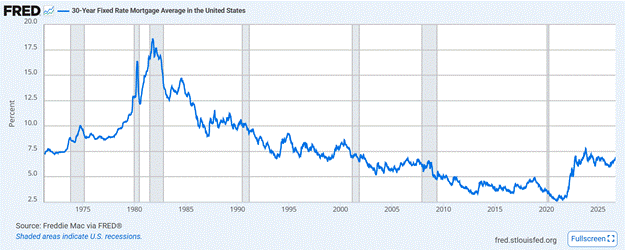
30-year fixed mortgage rate since 1971 (FRED MORTGAGE30US)
The same argument gets made about mortgages. Freddie Mac’s 30-year fixed rate averaged 6.76% on September 10th and the response from the hawks is that 6% to 7% was normal in the 1990s and early 2000s. It was. It’s also irrelevant to anyone who bought a home or refinanced between 2012 and 2021 when the chart above shows the 30-year sitting between roughly 2.65% and 5%. Freddie Mac’s average for 2021 was 2.96%. Home prices didn’t stay at 2012 levels while rates fell. They rose with the cheap money and now the cheap money is gone and the prices are still here.
Run the math on a $400,000 mortgage. At 2.96% the principal and interest payment is $1,678 per month. At 6.76% it’s $2,597. That’s $919 more every month or roughly $11,000 a year before taxes, insurance and maintenance. Over 30 years the total interest goes from about $204,000 to about $535,000 on the same house. The household that locked in 2.96% isn’t selling and the household that wants to buy can’t afford to. That’s why housing starts fell 12.4% in July and existing home sales are running at a 3.98 million annual pace. The hike makes that worse at the margin and it does nothing for the price of gasoline.
Paycheck to paycheck households compound debt faster
This is the part that bothers me most. The July CNBC and SurveyMonkey money survey found that 63% of Americans are living paycheck to paycheck. Among that group 90% have less than $500 left over each month after expenses and 37% of all Americans either break even or run a deficit every month. For households earning under $50,000 the paycheck to paycheck figure is 81%. The Fed’s own household survey found that 15% of adults would put a $400 emergency on a credit card and carry the balance while 12% couldn’t cover it at all.
Those same households are paying more to borrow. Federal Reserve data has the average rate on credit card accounts assessed interest at 22.15% in Q2 2026 which is up from 16.45% in 2021. Most card APRs float off the prime rate and prime moves with the funds rate so yesterday’s hike lands on next month’s statement. I ran the math on a household carrying a $6,500 balance. The same debt that cost $1,069 a year to service at the 2021 rate costs $1,440 today. That’s $120 a month in interest before any principal comes off. Yesterday’s 25 bps only adds about $16 a year on that balance. The bigger issue is that the dot plot points to another hike before year end and the balance itself keeps growing so this math gets worse from here.
That’s where compounding does its damage. A household that runs $250 short every month and puts the gap on a card at 22.15% owes about $7,600 after two years on $6,000 of actual spending. The interest becomes principal and then the card charges interest on the interest. Gasoline is back at $4 a gallon so the shortfall is growing at the same time the rate on the shortfall is going up. The personal saving rate is 3% and real disposable income is up 0.45% YoY so there’s no cushion to absorb either one. Warsh said at the press conference that the hike is good news for the least well-off Americans because price stability protects real wages. I don’t see it that way. The least well-off don’t own the Treasuries that yield more after a hike. They carry the balances that cost more after a hike.
Corporate America borrowed at 2.5% and now has to roll at 6%
The corporate side works on a delay which is why it gets ignored. Companies used the window from 2010 through 2021 and especially 2020 and 2021 to issue long-dated fixed-rate debt at rates that aren’t coming back. That debt didn’t reprice when the Fed hiked in 2022 and 2023 which is why the economy absorbed 525 bps of tightening better than most people expected. Maturity walls arrive eventually. S&P Global (SPGI) reported that rated US corporate debt totaled $13.07 trillion at the start of 2026 with about 47% maturing through 2030 and its midyear analysis put the nonfinancial maturity peak at roughly $1.02 trillion in 2029 with the B-minus and below cohort peaking in 2028.
On September 10th the investment-grade corporate index yielded 5.68% and the high-yield index yielded 7.42%. A company that borrowed $1 billion for five years at 2.5% in 2021 has been paying $25 million a year in interest. Rolling that at 5.7% takes the bill to about $57 million. At 7.4% it’s $74 million. That’s the same company with the same revenue and the same employees paying two to three times as much to service the same debt. Long-term yields respond to expected growth and inflation more than to any single Fed move but the front end of the curve follows the policy path closely and that’s where floating-rate loans and near-term maturities reprice. The December hike the dot plot is signaling would push it higher again.
Now layer the input costs on top. Producer prices rose 5.4% YoY in August with diesel up 24.1% in a single month and transportation and warehousing up 2.3%. A trucking company, a distributor, a manufacturer or a retailer is facing higher fuel, higher freight and higher inventory carrying costs at the exact moment its term loan or its bonds reprice. If revenue can’t reprice fast enough then margins compress and management works through a short list. Delay CapEx. Freeze hiring. Cut discretionary spending. Raise prices if the customer can bear it. Reduce headcount if they can’t. The giant tech companies with cash-heavy balance sheets will be fine. The smaller issuers, the cyclicals and the private-equity-backed businesses with floating-rate loans won’t be and those businesses employ a lot more people than the megacaps do.
Unemployment is a lagging indicator and it moves fast once it turns
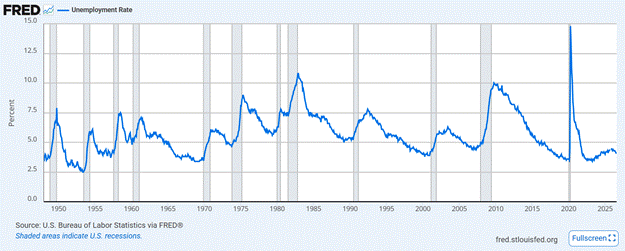
US unemployment rate since 1948 (FRED UNRATE)
The unemployment rate was 4.1% in August and payrolls grew by 162,000 which is the number the Fed pointed to when it said the labor market is strong. I’d be careful with that. July was revised from a loss of 23,000 to a gain of 21,000 which is barely positive and information employment fell by 23,000 in August. Look at the chart above. Unemployment rarely drifts higher. It tends to sit at a trough and then move fast and every one of those spikes started from a level that looked fine at the time. It was 3.5% in early 2020 and 4.4% in 2007 and 3.9% in 2000. The Fed is hiking at 4.1% with the unemployment rate as its evidence that the economy can take it. That’s the same evidence that was available before every recession on that chart. Fed governors have been pretty open about how long rate hikes take to work. Governor Michelle Bowman summarized research showing a rate shock does its biggest damage to GDP about 18 months later and the labor market doesn’t feel the worst of it for closer to two years. Governor Christopher Waller puts the lag at 12 to 24 months. The Fed is raising rates to fight an oil problem that oil markets may solve on their own by 2027. If that happens the economy takes the full hit from this tightening cycle just as crude rolls over and the Fed finds itself cutting into a slowdown it helped cause which is the textbook path from a supply shock to a demand recession. I don’t know that it plays out this way and neither does anyone at the Fed. It’s the risk I’ll be watching through 2027.
The federal government is the biggest refinancer of all
The Treasury has $31.82 trillion of marketable debt outstanding and 34% of it or $10.83 trillion matures within 12 months. That block carries a weighted coupon of 3.40%. Refinancing it at the September 14th curve means 4.03% which adds $67.5 billion a year in interest on that bucket alone. Within 60 months the added interest is $220.8 billion a year. The Treasury already paid $1.359 trillion in interest over the trailing twelve months. I’m not arguing the Fed should set policy to make the Treasury’s bill smaller. That would be fiscal dominance and it’s a line the Fed shouldn’t cross. I’m arguing that a third of the federal debt rolling inside a year means monetary policy transmits faster than the textbook says and every bp of hikes lands on the budget almost immediately. That’s money that can’t fund anything else and eventually it becomes higher taxes, lower spending or more borrowing. Those figures come from the debt maturity model on Nowflation and they’re a sensitivity estimate rather than a forecast. Treasury changes its mix of bills, notes and bonds, securities mature throughout the year and future yields are unknown. The point is the direction and the speed of the transmission, not the exact dollar amount.
The Fed’s strongest argument and why I still disagree
I want to take the other side seriously because the numbers I’ve been using are CPI numbers and the Fed doesn’t target CPI. It targets PCE inflation and on that measure the picture is hotter. The September projections have the median official expecting 2026 headline PCE at 3.7% and core PCE at 3.4% with the funds rate at 4.1% by year end. Core PCE was 3.34% in July on the latest print. When the Fed cut by 50 bps in September 2024 core PCE was closer to 2.7%. So the comparison I made at the top of this article works on core CPI and it doesn’t work as cleanly on core PCE. A hawk will point that out and they’d be right to.
The Fed’s actual argument also isn’t that a hike produces oil. Warsh said as much when he acknowledged the Fed can’t control the price of oil or food. His case is that tightening now stops a relative price shock in energy from broadening into general inflation through wages, services and expectations. That’s a legitimate concern and it’s the framework central banks have used for decades. If the second round were showing up in the data I’d be more sympathetic to the hike.
It isn’t showing up. Average hourly earnings slowed to 3.1% YoY. Services excluding energy services are running at 3% and core CPI decelerated in August rather than accelerating. The 5-year 5-year forward sat at 2.34% before the meeting which means people with real money at risk were pricing long-run inflation near target in the middle of an oil shock. My disagreement isn’t about whether inflation is above target. It is. My disagreement is about whether destroying demand across the whole economy is the right response when the excess came from a physical shortage and the second-round effects the Fed is worried about haven’t appeared. With core CPI at 2.4% a funds rate of 3.75% to 4.00% is a real rate of roughly 1.5% which wasn’t neutral for any of the borrowers in this article before the hike. The market had already tightened. The Fed stacked another layer on top.
The trade-off the Fed is making
Every rate decision is a trade-off and this one is lopsided. On one side the Fed gets whatever demand destruction 25 bps buys against a 3.4% headline number where the excess is almost entirely energy. On the other side every household with a variable-rate balance pays more next month, every company with a maturity in the next three years refinances higher, every new homebuyer gets priced further out and the Treasury adds tens of billions to its interest bill. The Fed gets a small reduction in demand and the economy gets a large increase in cost. That’s a bad trade when the inflation you’re fighting came from a shortage you can’t fix.
The free market was already doing the work. Oil at $100 is the mechanism that balances an oil market. The IEA expects world demand to fall by 2.5 million barrels per day this year without a single rate hike because people drive less, businesses conserve and producers with spare capacity bring it online when the price justifies it. The EIA path on the Nowflation tracker has Brent averaging about $62 in December 2027 as the deficit becomes a surplus of 5.2 million barrels per day. Prices fix shortages. Rates don’t. When the Fed hikes into a shortage it doesn’t speed up the fix. It just adds a second cost on top of the first one and that second cost falls hardest on the people and businesses that were already behind.
Conclusion
Inflation has been above target for more than five years, core PCE is running above 3% and Warsh doesn’t want his tenure to start by looking through a third supply shock. The Michigan long-run expectations reading at 3.4% is a real concern. If I were arguing for the hike that’s where I’d start. It still doesn’t change my view. The Fed can change the price of money and that’s where its power ends. It can’t produce oil so using rates against a shortage means forcing the rest of the economy to use less of it. Inflation may fall but it falls because households spend less, companies invest less and employers hire fewer people. The barrels don’t come back any sooner.
You can’t expect 63% of Americans living paycheck to paycheck to absorb higher card rates and $4 gasoline at the same time. You can’t expect a company that financed itself at 2.5% to roll into 6% or 7% while diesel is up 24% in a month and keep its margins and its headcount intact. You can’t expect a housing market built on 3% mortgages to function at 6.76%. The Fed did it anyway and the dot plot says it plans to do it again. My view is the Fed should have held at 3.50% to 3.75% and let the price of oil do what the price of oil always does. Instead it turned an energy problem into a credit problem and the bill for that comes due in 2027.